
Unit 22 Class 10 Math Sindh Board Solutions
Unit 22 of Class 10 Mathematics Sindh Board is about Introduction to Statistics. In this unit, students learn how to collect, organize, represent, and analyze data. This chapter is important because statistics is used in daily life, science, business, education, surveys, and many real-world situations.
On this page, students can download complete Unit 22 Class 10 Math Sindh Board Solutions in PDF format. The PDF includes student-friendly and step-by-step solutions of Exercise 22.1, Exercise 22.2, Exercise 22.3, Exercise 22.4, Exercise 22.5, and Review Exercise 22. The uploaded solution file also includes an essential formula sheet before the exercises, covering mean, geometric mean, harmonic mean, variance, standard deviation, median, quartiles, mode, and relative standard deviation.
Class 10 Math Unit 22 Introduction to Statistics Solutions
Statistics is the branch of mathematics that deals with data. In this unit, students study different types of data, frequency tables, graphs, averages, measures of dispersion, and grouped data calculations.
The main purpose of Unit 22 is to teach students how to understand data properly. Instead of only looking at numbers, students learn how to arrange them in tables, draw graphs, calculate averages, and find how much the values differ from each other.
This unit is a little lengthy because it contains many formulas and table-based questions. Therefore, students should solve it carefully and should not skip steps while finding totals, class marks, cumulative frequencies, deviations, and final answers.
What is Included in Unit 22 Class 10 Math Sindh Board Solutions?
The PDF includes complete solutions combined in a single PDF for the following exercises:
Exercise 22.1
Exercise 22.2
Exercise 22.3
Exercise 22.4
Exercise 22.5
Review Exercise 22
These solutions are written for Sindh Board Class 10 students and explain the working in a clear step-by-step style.
The PDF Solutions cover step by step solutions of following topics:
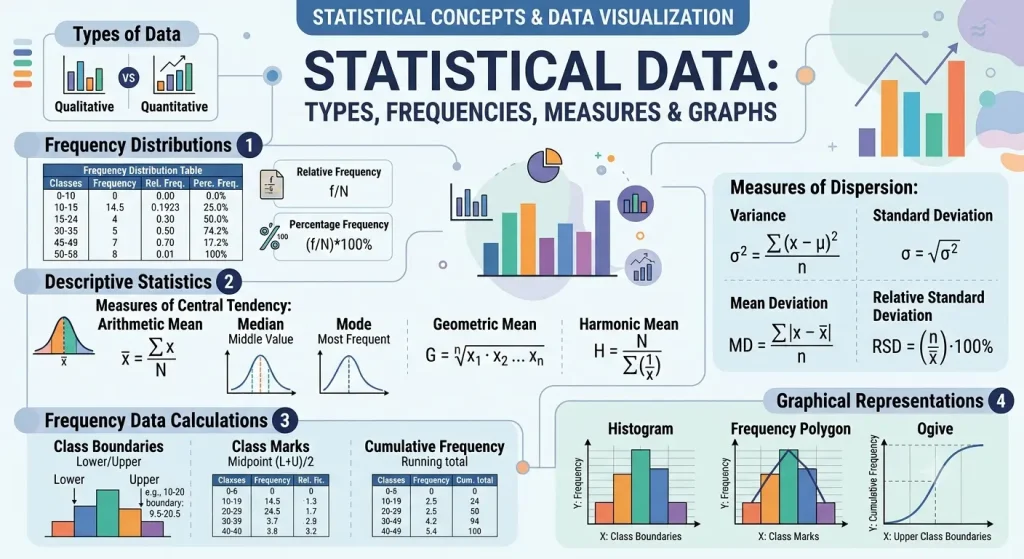
Types of data
Frequency distributions
Relative frequency
Percentage frequency
Class boundaries
Class marks
Cumulative frequency
Histogram
Frequency polygon
Ogive
Arithmetic mean
Geometric mean
Harmonic mean
Median
Mode
Quartiles
Variance
Standard deviation
Mean deviation
Relative standard deviation
Exercise 22.1 Solutions
Exercise 22.1 focuses on the basic organization of data. In this exercise, students learn how to classify data and make frequency tables.
The exercise includes questions about:
Discrete data
Continuous data
Nominal data
Ordinal data
Frequency tables
Relative frequency
Percentage frequency
Cumulative frequency
Class intervals
Class boundaries
Class marks
Students should remember that a count is usually discrete, while a measurement is usually continuous. For example, the number of visitors in a mall is discrete, but the weight of students is continuous.
A useful formula from this part is:
\(\text{Relative Frequency}=\frac{f}{n}\)
and percentage frequency is calculated by:
\(\text{Percentage Frequency}=\frac{f}{n}\times 100\%\)
In grouped data questions, students also use class marks. The class mark is found by:
\(\text{Class Mark}=\frac{\text{Lower Limit}+\text{Upper Limit}}{2}\)
This exercise is important because later exercises also depend on correct frequency tables and class marks.
Exercise 22.2 Solutions
Exercise 22.2 is about graphical representation of data. In this exercise, students learn how to draw and interpret histograms, frequency polygons, relative frequency polygons, cumulative frequency tables, and ogives.
A histogram is used to represent grouped data with bars. When class intervals are equal, the frequency can be used as the height of the bar. But when class intervals are unequal, students must use frequency density.
The formula is:
\(\text{Frequency Density}=\frac{f}{\text{Class Width}}\)
This is very important because using ordinary frequency for unequal class intervals gives a wrong histogram.
Exercise 22.2 also includes less-than ogives. For an ogive, students use upper class boundaries and cumulative frequencies.
For example, if cumulative frequencies are calculated step by step, then the final cumulative frequency must be equal to the total number of observations. This is a useful way to check the answer.
Exercise 22.3 Solutions
Exercise 22.3 deals with averages and measures of central tendency. In this exercise, students find arithmetic mean, geometric mean, harmonic mean, median, and mode.
The arithmetic mean is found by:
\(\bar{x}=\frac{\sum x}{n}\)
For frequency distribution, the arithmetic mean is:
\(\bar{x}=\frac{\sum fx}{\sum f}\)
Geometric mean is found by:
\(\log G=\frac{\sum f\log x}{\sum f}\)
or for ungrouped data:
\(\log G=\frac{\sum \log x}{n}\)
Harmonic mean is found by:
\(\displaystyle H=\frac{n}{\sum \frac{1}{x}}\)
For frequency distribution:
\(\displaystyle H=\frac{\sum f}{\sum \frac{f}{x}}\)
Students should be careful that geometric mean and harmonic mean are not always possible. If the data contain zero or negative values, then the usual geometric mean by logarithms and harmonic mean may not be meaningful at this level.
Median is the middle value after arranging data in ascending order. Mode is the value that occurs most frequently.
Exercise 22.4 Solutions
Exercise 22.4 focuses on grouped data calculations. Students learn how to find median, quartiles, and mode from grouped frequency distributions.
For grouped data, the median formula is:
\(\displaystyle \text{Median}=L+\frac{\frac{N}{2}-c}{f}\times h\)
The first quartile is:
\(\displaystyle Q_1=L+\frac{\frac{N}{4}-c}{f}\times h\)
The third quartile is:
\(\displaystyle Q_3=L+\frac{\frac{3N}{4}-c}{f}\times h\)
The mode formula for grouped data is:
\(\displaystyle \text{Mode}=L+\frac{f_1-f_0}{2f_1-f_0-f_2}\times h\)
Here:
\(\displaystyle L\) is the lower boundary of the required class.
\(\displaystyle N\) is the total frequency.
\(\displaystyle c\) is the cumulative frequency before the required class.
\(\displaystyle f\) is the frequency of the required class.
\(\displaystyle h\) is the class width.
\(\displaystyle f_1\) is the frequency of the modal class.
\(\displaystyle f_0\) is the frequency before the modal class.
\(\displaystyle f_2\) is the frequency after the modal class.
This exercise needs careful table work. Students should first find cumulative frequencies, then identify the correct median class, quartile class, or modal class.
Exercise 22.5 Solutions
Exercise 22.5 is about dispersion. Dispersion tells us how spread out the data values are.
This exercise includes questions about:
Range
Mean deviation
Variance
Standard deviation
Relative standard deviation
The variance formula is:
\(\displaystyle \sigma^2=\frac{\sum (x-\bar{x})^2}{n}\)
For frequency distribution, standard deviation is:
\(\displaystyle \sigma=\sqrt{\frac{\sum f(x-\bar{x})^2}{\sum f}}\)
Mean deviation about mean is:
\(\displaystyle \text{M.D. about mean}=\frac{\sum |x-\bar{x}|}{n}\)
Relative standard deviation is:
\(\displaystyle \text{Relative S.D.}=\frac{\sigma}{\bar{x}}\times 100\%\)
Students should remember that standard deviation is always positive. A smaller standard deviation means the data values are closer to the mean. A larger standard deviation means the values are more spread out.
Review Exercise 22 Solutions
Review Exercise 22 is based on the full unit. It helps students revise the important concepts of statistics before exams.
The review exercise may include MCQs, short questions, definitions, numerical questions, and table-based problems. Students should revise formulas before solving the review exercise because this unit contains many different methods.
The review exercise is useful for checking whether students understand:
How to classify data
How to make frequency tables
How to calculate averages
How to draw statistical graphs
How to find median and mode from grouped data
How to calculate standard deviation and related measures
Important Formulas of Unit 22
Here are some important formulas students should revise before solving Unit 22.
Arithmetic mean:
\(\displaystyle \bar{x}=\frac{\sum x}{n}\)
Mean for frequency distribution:
\(\displaystyle \bar{x}=\frac{\sum fx}{\sum f}\)
Geometric mean:
\(\displaystyle G=(x_1x_2x_3\cdots x_n)^{1/n}\)
Geometric mean using logarithms:
\(\displaystyle \log G=\frac{\sum f\log x}{\sum f}\)
Harmonic mean:
\(\displaystyle H=\frac{n}{\sum \frac{1}{x}}\)
Harmonic mean for frequency distribution:
\(\displaystyle H=\frac{\sum f}{\sum \frac{f}{x}}\)
Variance:
\(\displaystyle \sigma^2=\frac{\sum (x-\bar{x})^2}{n}\)
Standard deviation:
\(\displaystyle \sigma=\sqrt{\frac{\sum f(x-\bar{x})^2}{\sum f}}\)
Mean deviation about mean:
\(\displaystyle \text{M.D. about mean}=\frac{\sum |x-\bar{x}|}{n}\)
Relative standard deviation:
\(\displaystyle \text{Relative S.D.}=\frac{\sigma}{\bar{x}}\times 100\%\)
Median for grouped data:
\(\displaystyle \text{Median}=L+\frac{\frac{N}{2}-c}{f}\times h\)
First quartile:
\(\displaystyle Q_1=L+\frac{\frac{N}{4}-c}{f}\times h\)
Third quartile:
\(\displaystyle Q_3=L+\frac{\frac{3N}{4}-c}{f}\times h\)
Mode for grouped data:
\(\displaystyle \text{Mode}=L+\frac{f_1-f_0}{2f_1-f_0-f_2}\times h\)
Common Mistakes in Unit 22
Many students make mistakes in Unit 22 because they do not prepare tables carefully.
One common mistake is forgetting to calculate the class mark. For grouped data, the class mark is needed in many mean and standard deviation questions.
Another common mistake is using frequency instead of frequency density when class intervals are unequal. In unequal class intervals, histogram height should be frequency density, not ordinary frequency.
Some students also forget to arrange values before finding the median. Median can only be found correctly after arranging the data in ascending order.
In grouped data questions, students sometimes choose the wrong median class or quartile class. Always calculate cumulative frequency first, then locate the required class.
Students should also avoid rounding too early. It is better to keep calculations accurate and round only the final answer.
How to Prepare Unit 22 for Exams
To prepare this unit well, students should first memorize the basic formulas. After that, they should practice table-based questions because most statistics questions require proper organization of data.
Students should give special attention to:
Frequency tables
Cumulative frequency
Class marks
Histograms
Ogives
Arithmetic mean
Median
Mode
Standard deviation
This unit becomes easier when students solve questions step by step. First write the formula, then substitute values, then simplify carefully, and finally write the answer with proper units if needed.
Why These Solutions Are Helpful
These Unit 22 Class 10 Math Sindh Board Solutions are helpful because the working is detailed and student-friendly. Statistics questions usually require many small calculations, so skipping steps can confuse students.
The solutions explain how to make tables, how to calculate totals, how to use formulas, and how to check answers. This makes the PDF useful for homework, test preparation, and board exam revision.
Download Unit 22 Class 10 Math Sindh Board Solutions PDF
Students can download the complete PDF of Unit 22 Class 10 Math Sindh Board Solutions from this page.
The PDF includes complete step-by-step solutions of:
Exercise 22.1
Exercise 22.2
Exercise 22.3
Exercise 22.4
Exercise 22.5
Review Exercise 22
These solutions cover the full chapter Introduction to Statistics from Class 10 Mathematics Sindh Textbook Board.