Unit 7 Class 9 Math Solutions Sindh Board – Linear Graphs and Their Applications
Unit 7 Class 9 Math Solutions Sindh Board are available below for Exercises 7.1 to 7.3 and the Unit 7 Review Exercise. Students can view and download each PDF to study complete step-by-step solutions.
This unit covers ordered pairs, the Cartesian plane, plotting points, graphs of linear equations and practical applications of straight-line graphs. For other units, visit our Class 9 Math Notes Sindh Board page.
Unit 7 Class 9 Math Exercise Solutions
Select an exercise below to view or download its complete PDF solutions.
Unit 7 Quick Overview
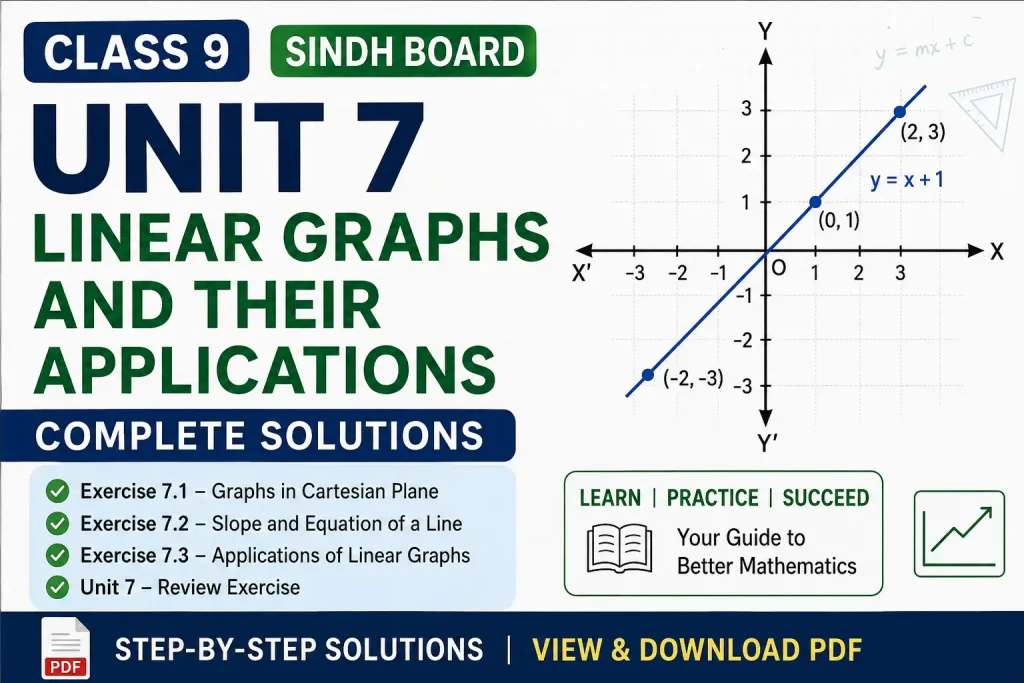
What Are Linear Graphs?
A linear graph is the graph of a linear equation in two variables. It forms a straight line on the Cartesian plane.
A common form of a linear equation is:\[ y=mx+c \]
Here, \(m\) represents the slope and \(c\) represents the y-intercept.
For example:\[ y=2x+1 \]
If \(x=0\), then:\[ y=2(0)+1=1 \]
This gives the ordered pair:\[ (0,1) \]
If \(x=1\), then:\[ y=2(1)+1=3 \]
This gives the ordered pair:\[ (1,3) \]
Plotting these points and joining them gives a straight line.
Exercise 7.1 – Ordered Pairs and the Cartesian Plane
Exercise 7.1 introduces ordered pairs, coordinate axes, quadrants and the location of points on the Cartesian plane.
Ordered Pairs
An ordered pair is written in the form:\[ (x,y) \]
The first number gives the horizontal position and the second number gives the vertical position.
For example:\[ (3,2) \]
means moving 3 units along the x-axis and 2 units along the y-axis.
The order matters:\[ (3,2)\neq(2,3) \]
The Cartesian Plane
The Cartesian plane is formed by two perpendicular number lines:
- The horizontal line is the x-axis.
- The vertical line is the y-axis.
- Their point of intersection is the origin.
\[ O=(0,0) \]
Quadrants
| Quadrant | Signs |
|---|---|
| First | \((+,+)\) |
| Second | \((-,+)\) |
| Third | \((-,-)\) |
| Fourth | \((+,-)\) |
For example:\[ (4,3) \]
lies in the first quadrant, while:\[ (-4,3) \]
lies in the second quadrant.
Points on the Axes
A point on the x-axis has the form:\[ (a,0) \]
A point on the y-axis has the form:\[ (0,b) \]
Plotting Points
- Start from the origin.
- Move horizontally according to the x-coordinate.
- Move vertically according to the y-coordinate.
- Mark and label the point.
Drawing Shapes on a Graph
Several points can be plotted and joined to form geometrical shapes.
For example:\[ A(1,1),\quad B(5,1),\quad C(5,4),\quad D(1,4) \]
These points form a rectangle when joined in order.
Exercise 7.2 – Graphs of Linear Equations
Exercise 7.2 focuses on constructing tables of values and drawing graphs of linear equations in two variables.
Linear Equation in Two Variables
The general form is:\[ ax+by+c=0 \]
For example:\[ x+y=4 \]
Some ordered-pair solutions are:\[ (0,4),\quad(1,3),\quad(2,2),\quad(3,1),\quad(4,0) \]
Constructing a Table of Values
Consider:\[ y=x+2 \]
| \(x\) | \(y\) | Ordered Pair |
|---|---|---|
| -2 | 0 | \((-2,0)\) |
| 0 | 2 | \((0,2)\) |
| 2 | 4 | \((2,4)\) |
Plot the points and join them with a straight line.
Checking a Point
Consider:\[ y=2x+1 \]
Check the point:\[ (2,5) \]
Substitution gives:\[ 5=2(2)+1 \] \[ 5=5 \]
Therefore, the point lies on the graph.
Horizontal Lines
An equation of the form:\[ y=c \]
represents a horizontal line parallel to the x-axis.
Vertical Lines
An equation of the form:\[ x=a \]
represents a vertical line parallel to the y-axis.
Lines Passing Through the Origin
An equation of the form:\[ y=mx \]
passes through the origin.
Slope-Intercept Form
The form:\[ y=mx+c \]
shows the slope \(m\) and y-intercept \(c\).
Exercise 7.3 – Applications of Linear Graphs
Exercise 7.3 uses linear graphs to represent relationships between quantities and solve practical problems.
Conversion Graphs
A conversion graph shows the relationship between two units.
For example:\[ 8\text{ km}=5\text{ miles} \]
| Kilometres | Miles |
|---|---|
| 0 | 0 |
| 8 | 5 |
| 16 | 10 |
| 24 | 15 |
Temperature Conversion
The relationship between Celsius and Fahrenheit is:\[ F=\frac{9}{5}C+32 \]
For \(C=20\):\[ F=\frac{9}{5}(20)+32=68 \]
Currency Conversion Graphs
If one unit of a foreign currency equals \(r\) Pakistani rupees, then:\[ y=rx \]
Students should use the exchange rate given in the textbook question.
Cost and Quantity Graphs
If one item costs \(p\) rupees and \(x\) items are purchased, then:\[ y=px \]
For example, if one notebook costs 40 rupees:\[ y=40x \]
Graphical Solution of Two Equations
Two linear equations can be solved by drawing both graphs on the same coordinate plane.
For example:\[ x+y=5 \] \[ x-y=1 \]
The lines intersect at:\[ (3,2) \]
Therefore:\[ x=3,\qquad y=2 \]
Possible Relationships Between Two Lines
- Intersecting lines give one solution.
- Parallel lines give no common solution.
- Coincident lines give infinitely many solutions.
Reading Values from a Graph
- Locate the known value on one axis.
- Move toward the graph.
- Move from the graph to the other axis.
- Read the corresponding value using the scale.
Unit 7 Review Exercise
- Ordered pairs and quadrants
- Cartesian plane and coordinate axes
- Plotting points
- Drawing shapes using coordinates
- Linear equations in two variables
- Tables of ordered pairs
- Horizontal and vertical lines
- Graphs in the form \(y=mx+c\)
- Conversion graphs
- Graphical solution of equations
- Practical applications of linear graphs
- Multiple-choice and short questions
Important Forms and Rules from Unit 7
\[ ax+by+c=0 \] \[ y=mx+c \] \[ y=c \] \[ x=a \] \[ y=mx \] \[ F=\frac{9}{5}C+32 \]
Common Mistakes to Avoid
- Writing the y-coordinate before the x-coordinate
- Using incorrect quadrant signs
- Choosing an unsuitable scale
- Failing to label the axes
- Plotting points inaccurately
- Drawing a curved line instead of a straight line
- Using only one point to draw a line
- Making errors in the table of values
- Confusing horizontal and vertical lines
- Reading values from the wrong axis
How to Prepare Unit 7 for Exams
Learn the signs of coordinates in all four quadrants and practise plotting points accurately.
Choose a suitable scale, label both axes and mark every point clearly.
Prepare a table with at least two or three ordered pairs before drawing a linear graph.
Practise horizontal lines, vertical lines, lines through the origin and conversion graphs.
After attempting each question, use the Unit 7 Class 9 Math Solutions Sindh Board PDFs to check your table, graph and final answer.
Why These Unit 7 Solutions Are Helpful
- Explain ordered pairs and quadrants
- Show how to plot points correctly
- Explain tables of values
- Show how to draw straight-line graphs
- Cover horizontal and vertical lines
- Explain conversion graphs
- Help solve equations graphically
- Support homework and exam preparation
Frequently Asked Questions
What is the name of Unit 7?
The name of Unit 7 is Linear Graphs and Their Applications.
How many exercises are included?
Unit 7 contains Exercises 7.1, 7.2 and 7.3, followed by a Review Exercise.
What is covered in Exercise 7.1?
Exercise 7.1 covers ordered pairs, quadrants, plotting points and drawing shapes.
What is covered in Exercise 7.2?
Exercise 7.2 covers tables of values and graphs of linear equations.
What is covered in Exercise 7.3?
Exercise 7.3 covers conversion graphs, applications and graphical solutions.
Can students download the PDFs?
Yes. Separate viewable and downloadable PDFs are provided for all exercises and the review exercise.
Related Class 9 Math Resources
- Class 9 Math Notes Sindh Board
- Unit 6 Class 9 Math Solutions Sindh Board
- Unit 8 Class 9 Math Solutions Sindh Board
Disclaimer
These solutions are prepared for educational support. Students should also consult their official Sindh Textbook Board Mathematics book and follow their teacher’s instructions.
Final Words
The Unit 7 Class 9 Math Solutions Sindh Board provide complete exercise-wise help with ordered pairs, Cartesian coordinates, linear equations, straight-line graphs and their applications.
For solutions to all other units, visit the Class 9 Math Notes Sindh Board page.
